
Scientifically Diagnose Organizational Critical Issues with AI – Emotional Analytic Solutions.
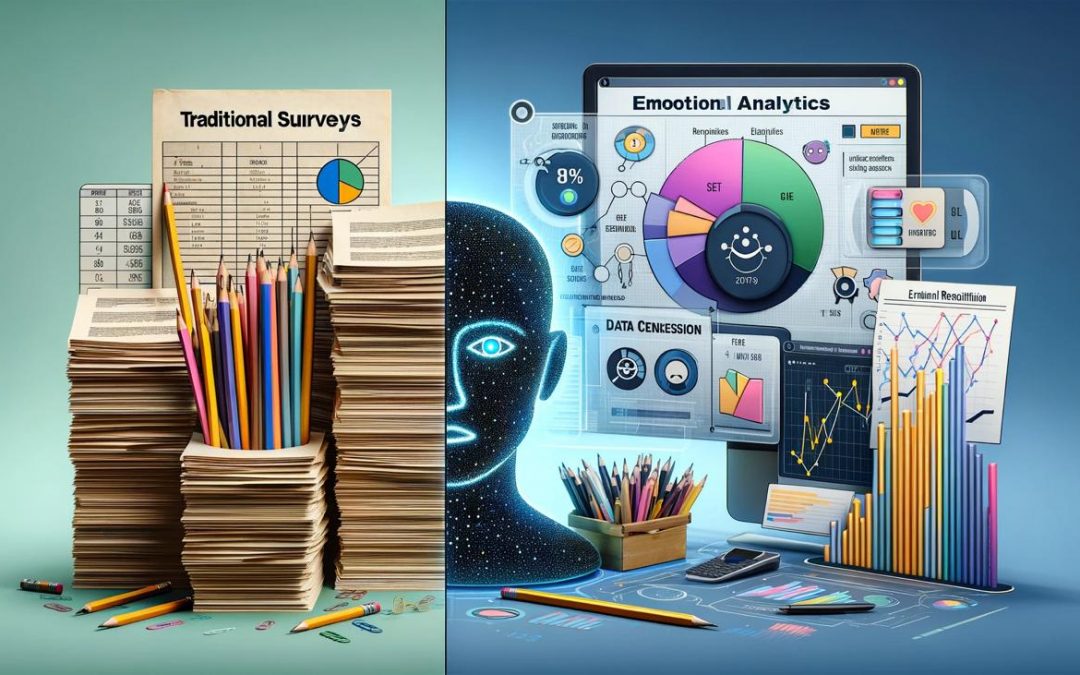
The landscape of organizational assessment is evolving, with traditional survey methods complementing more dynamic and emotionally intelligent tools like ETC Solution’s open-ended questionnaires. This comparative mapping aims to bridge the gap between these two distinct approaches—traditional closed-ended surveys and ETC Innovation’s emotionally and contextually rich open-ended questions.
The objective is to identify common critical issues that both methods aim to explore, thereby providing a comprehensive framework for understanding and correlating the data generated by each. This mapping serves as a guide for organizations to leverage the strengths of both approaches, ensuring a more holistic understanding of employee engagement, innovation metrics, leadership vision, and other critical organizational factors.
Traditional Surveys with Closed-ended Questions
-
Quantitative Data: Traditional surveys primarily yield quantitative data that is easy to analyze statistically. The responses are often limited to predefined options like ‘Yes/No’ or a Likert scale (e.g., Strongly Agree to Disagree Strongly).
-
Limited Scope: The data collected is restricted to the questions asked. There’s little room for respondents to provide additional context or nuance to their answers.
-
Surface-Level Insights: These surveys are generally good for gathering surface-level information but may not capture the complexities of human emotion or thought processes.
-
Lack of Emotional Context: Traditional surveys need to capture emotional data or sentiments behind the responses, making it difficult to gauge the emotional state or group dynamics.
-
Generalized Findings: The results usually offer a generalized view that may not account for individual or group-specific nuances.
ETC Solutions with Open-Ended Responses and Emotional Data
-
Qualitative Data: ETC solutions collect rich, qualitative data through open-ended questions, allowing a deeper understanding of the subject matter.
-
Emotional Analytics: One of the standout features is the ability to capture emotional data across answers. This provides a more holistic view of the respondent’s state of mind and can be crucial for diagnosing critical issues.
-
Group Sentiment Analysis: ETC solutions can analyze the collective emotional state or sentiment of a group, providing valuable insights into group dynamics, morale, and potential areas of concern.
-
Complex Insights: The open-ended nature of the questions allows respondents to provide detailed answers, which can be analyzed for complex insights and patterns.
-
Highly Contextual: The data collected is highly contextual and can be used to make more nuanced and tailored strategies or interventions.
-
Innovative Diagnostics: ETC’s advanced AI technology allows for a scientific diagnosis of critical issues and corporate climate, something traditional surveys are not equipped to handle.
In summary, while traditional surveys with closed-ended questions help gather straightforward, quantitative data, ETC solutions offer an emotionally rich, and contextually detailed data set. This makes ETC solutions particularly valuable for organizations looking to deeply understand and address complex issues such as employee engagement, group dynamics, and emotional well-being.
You can employ a multi-step approach to correlate the survey questions with the ETC Innovation questions, before and after the process is completed. This will help you understand how the two sets of questions relate and evolve.
Surveys vs ETC Solutions – Pre-Process Correlation:
-
Identify Common Critical Issues: First, identify critical issues or topics that the survey vs. the ETC Innovation questions aim to address. For example, both might have questions related to “innovation” or “team collaboration.”
-
Map Questions: Map each survey question to one or more corresponding
-
ETC Innovation questions based on these common critical issues.
-
Statistical Analysis: Use statistical methods to find the initial correlation between the mapped questions. This will give you a numerical value to represent the relationship.
Surveys vs ETC Solutions – Post-Process Correlation:
-
Data Collection: After the process (e.g., an innovation initiative or training program) is completed, administer the survey and ETC Innovation questions to the same volunteers again.
-
Re-calculate Correlations: Use the same statistical methods to re-calculate the correlation coefficients for the mapped questions.
-
Compare and Contrast: Compare the pre-process and post-process correlation coefficients to see how they have changed. A significant change could indicate the impact of the process on the variables being measured.
-
Emotional Analytics: Use ETC’s emotional analytics to assess how the emotional context has changed from pre-process to post-process. This can provide additional layers of correlation that go beyond the surface-level data.
-
Correlation Factors: Assign correlation factors like “Very High,” “High,” or “Moderate” based on the numerical values of the correlation coefficients, both pre-process and post-process.
By following this approach, you can establish a comprehensive correlation between the survey and ETC Innovation questions, both before and after the process. This will help you understand the relationship between the two and the impact of any interventions or processes on these variables.
How to map questions from the Survey against the questions in the ETC Solutions process (Pre-Process Correlation):
Mapping questions from a traditional survey to those in the ETC Innovation process involves identifying critical issues, topics, or constructs that both sets of questions aim to measure. Here’s a step-by-step guide on how to do it:
Step 1: Identify Common Critical Issues
Go through each question in the Survey and the ETC Innovation questionnaire. Identify common issues or constructs that both are trying to measure. For example, if both have questions related to “innovation,” “team collaboration,” or “problem-solving,” these can be considered common themes.
Step 2: Categorize Questions
Categorize each question under these critical Issues. For example, questions related to “How often do you seek diverse opinions?” from both sets can be categorized under a theme like “Diversity of Thought.”
Step 3: Direct Mapping
For each question in the Survey, find a corresponding question in the ETC Innovation questionnaire that measures the same or a similar construct. This is your direct map.
-
Example: If the Survey has a question like “I regularly ask questions that challenge the status quo,” ETC Innovation has a question like “Asking probing questions that lead to new insights, connections, possibilities, and directions,” these could be directly mapped as they both relate to challenging conventional thinking.
Step 4: Create a Mapping Table
Create a table where you list the Survey questions in one column and their corresponding ETC Innovation questions in another.
Step 5: Address Open-ended Questions
For open-ended questions in the ETC Innovation process, consider what theme or construct they are trying to measure and find a corresponding closed-ended question in the Survey, if available.
Step 6: Emotional and Sentimental Mapping
Since ETC Innovation also captures emotional data, identify if any of the Survey questions aim to capture similar emotional or sentiment-based data. If so, could you map these questions accordingly?
Step 7: Validate the Mapping
Validating the mapping with subject matter experts or through a pilot study is crucial to ensuring that the mapped questions truly measure similar constructs.
Step 8: Document the Mapping
Finally, document your mapping process and rationale for future reference or for sharing with stakeholders. Following these steps, you can comprehensively map questions from a traditional Survey to those in the ETC Innovation process. This will be the foundation for subsequent data analysis, including correlation studies.
This is a preliminary mapping that should be validated for its effectiveness in capturing similar constructs. The ETC Innovation questions are more open-ended and designed to capture emotional data, which adds another layer of complexity to the mapping.
Critical Issue: Innovation Metrics & Financial Performance
-
Traditional Survey: “I regularly ask questions that challenge the status quo.”
-
ETC Innovation: “Do you always look for better ways to do your job? Explain”
Critical Issue: Leadership Vision
-
Traditional Survey: “Our organization has leaders with a well-known track record for generating innovative ideas for new processes, products, services, or businesses.”
-
ETC Innovation: “How committed do you think the company is to Innovation? Why”
Critical Issue: Employee Engagement
-
Traditional Survey: “Our organization or team expects everyone to offer creative ideas for how the company should change products, processes, and so on.”
-
ETC Innovation: “What new ideas do you have for improving our products or services?”
Four Categories of Emotional Responses
ETC Solutions has identified four primary categories into which emotional responses can be classified:
-
Awareness: Responses in this category indicate a general understanding or acknowledgment of a situation or issue. It signifies that the respondent is cognizant of the circumstances but may not have a direct or personal experience.
-
Witness: This category encompasses responses from individuals who have observed or been privy to a particular situation or event. They might not have been directly affected but have a close understanding of the issue through observation.
-
Victim: Responses that fall under this category come from individuals directly affected or harmed by a situation. Their emotions and sentiments are often intense, stemming from personal experiences.
-
Perpetrator: This category includes responses from those who admit or are identified as causing or contributing to a particular situation or problem. Their emotions can range from guilt and remorse to justification of their actions.
Driving the Identification of Critical Issues
By categorizing emotional responses into these four groups, ETC Solutions can effectively pinpoint critical issues. For instance, a high number of responses in the ‘Victim’ category for a particular issue indicates a pressing problem that has directly affected many. Similarly, responses in the ‘Perpetrator’ category can shed light on the root causes of an issue.
Furthermore, by analyzing the emotional intensity and content of the responses, ETC Solutions can gauge the severity of the problem and prioritize interventions accordingly.
ETC Solutions’ innovative approach to sourcing emotional data through open-ended questions offers a fresh perspective on understanding human emotions and sentiments.
By categorizing responses into Awareness, Witness, Victim, and Perpetrator, they can effectively identify and address critical issues. In a world that’s rapidly becoming data-driven, the importance of emotional data, especially when sourced innovatively, cannot be understated.
")
Employee bias while responding to traditional Surveys.
> Scenario 1: New Employee (Recency Bias)
Context: Jamie, a new employee who joined the company two months ago, is responding to a company-wide engagement survey.
Response Bias:
-
Positive Overemphasis: Jamie may exhibit recency bias, focusing on recent experiences and first impressions. They might rate aspects like the ‘Onboarding Process and ‘Initial Training highly due to their recent positive experiences in these areas.
-
Limited Perspective: Having yet to experience a full cycle of operations or various team dynamics, Jamie might overrate the ‘Team Collaboration’ or ‘Leadership Effectiveness’ based on limited interactions that have been largely positive and welcoming.
-
Avoiding Negativity: As a new member, Jamie might avoid providing negative feedback or critical opinions about ‘Workplace Environment’ or ‘Organizational Values,’ fearing it could impact their standing or relationships within the company.
> Scenario 2: Medium-Tenured Employee (Status Quo Bias)
Context: Alex, an employee with three years at ETC Corp, participates in the same survey.
Response Bias:
-
Complacency Effect: Alex may demonstrate status quo bias. They give moderate to high ratings across the board, reflecting a comfort with current affairs, even if areas need improvement.
-
Resistance to Change: In sections like ‘Change Management’ or ‘Innovation Support,’ Alex might resist recent changes or new initiatives, preferring the familiarity of established methods.
-
Overlooking Long-Standing Issues: Alex might underrate or overlook issues in ‘Conflict Resolution’ or ‘Employee Recognition,’ having become accustomed to these as unchangeable parts of the workplace culture.
> Scenario 3: Veteran Employee (Confirmation Bias)
Context: Sam, a veteran employee with over 15 years at ETC Corp, fills out the survey.
Response Bias:
-
Confirmation of Beliefs: Sam may exhibit confirmation bias, interpreting questions and responding in ways that confirm their long-held beliefs about the company. For example, if Sam believes that the company has always been weak in ‘Employee Engagement’ or ‘Leadership Communication,’ they might rate these lower regardless of recent improvements.
-
Underestimating Recent Improvements: In areas like ‘Diversity and Inclusion’ or ‘Remote Work Experience,’ Sam might underrate the company’s recent progress, focusing on historical shortcomings.
-
Overvaluing Longevity: Sam might rate ‘Career Growth Opportunities’ highly, equating their long tenure with effective career progression, not necessarily considering the varied experiences of newer employees.